Logistic regression known as the logit model, is used to model binary result variables. In the logit model, the log odds of the result is displayed as a linear combination of the independent variables. It is one of the most commonly used methods in statistics is linear regression to predict a real-valued result. Logistic regression is an analytical method to examine/predict the direct relationship within an independent variable and dependent variables.
Logistic regression considers only the probability of the dependent variable and uses GLM() function that uses:
p: the probability of success
(1-p): the probability of failure
Where p should be positive (p >= 0) and should be less than 1 (p <= 1)
Points to remember :
- To use the logit function, the probability of each data point is calculated to feed the purpose
- To use logistic regression,
- Logistics regression model tries to get the best outcome considering each variable, unlike in linear regression where model tires to minimize all the residuals.
- The calculated coefficient value after running logistics regression tells us about the contribution towards log odds.
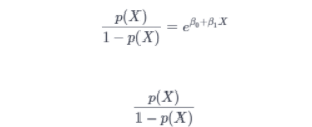
Logistic regression is calculated using below transformations:-
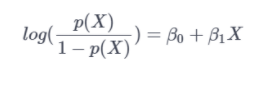
The above equation can be transformed :
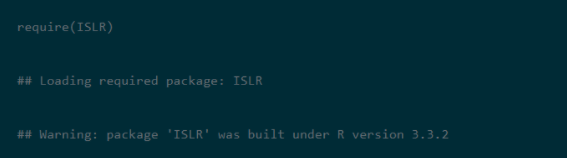
Taking log on both sides the final equation can be written as :-
ASSUMPTIONS :
Logistic regression is a particular case of the generalized linear model where the dependent variable or response variable is either a 0 or 1. It returns the target variables as probability values. But we can transform and obtain the benefits using threshold value. To apply logistic regression few assumptions were made:-
- The dependent or response variable should binomially distributed.
- There should be a linear relationship between the independent variables and the logit or link function.
- The response variable should be mutually exclusive.
Power pointers:
You might think when the response variable follows binomial distribution ?? but what is a binomial distribution……
- The binomial distribution contains a fixed number of trails.
- Each trail has only two possible outcomes, i.e. failure or success.
- The probability of the outcome of any trail (toss) remains fixed over time.
- The trails are statistically independent .i.e the outcomes of one toss does not affect the outcome of any other toss.
R is open-source software, which has a wide variety of libraries and packages available to perform the statistical tests with ease. R is authoritative for all types of analysis. R Programming gives a satisfying set of inbuilt functions and libraries like ggplot2, lattice, etc. to build models and visualization for a given collection of data.
Let’s take an example to understand how logistic regression is performed in R.
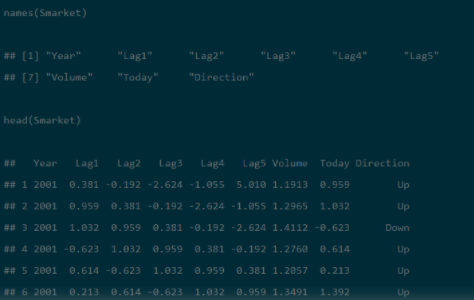
Step 1: Install and load the ISLR package. we can use the data sets present in the package for easy understand then apply the model on real data set.
Note : To explore the data use names() to check the names and data in the data frame, head() is a glimpse of the first few rows.
summary() is a function used for getting all the major insights of the data.
To check the density distribution of each variable. the density box helps to understand the separation of Up and Down. It creates an overlapping picture in direction value. GLM () function is commonly used to implement generalized linear models.
Step 2: the library “CARET ” is being installed and used to list down all the variables . perform data cleaning steps in order to treat outliers, treat missing values and also try creating some new variables using feature engineering technique and then train the sample. 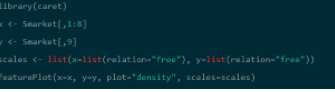
Step 3: summary() returns all the estimates, standard errors, z-score, and p-values for every coefficient. Here we can observe that none of the coefficients are significant. It gives us the null deviance and the residual deviance. With a minimal difference of 2, with 6 degrees of freedom.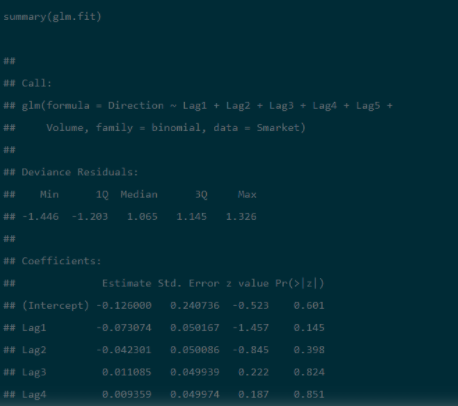
step 4: Training and Test Samples
Now, in order to perform logistic regression the sample is divided into two trains and test sample:
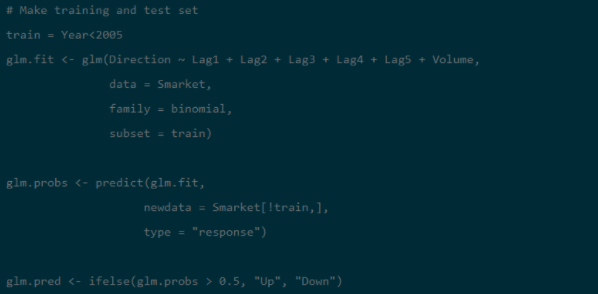
STEP 5: using the function predict
Predict2 <- predict (Smarket, type=’response’)
Create confusion matrix on training dataset using:
Table1(train$recommend, predict1>0.5)
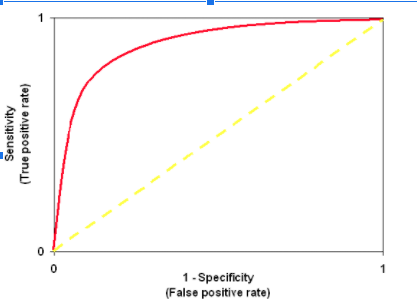
STEP 6: to check the predictability and reliability of the model use ROC Curve
Note : ROC is an area under the curve which gives us the accuracy of the model. Its is also known as the index of accuracy which represents the performance.
To interpret : more area under the curve proves better model. Graphically it is represented using two axis one is true positive rate and false positive Y and X axis respectively. The value should approaches to 1 in order to have a better model .
Download and use the download ROCR library
library(ROCR)
ROCRpred1 <- prediction(predict1, train$Recommend)
ROCRperf1 <- performance(ROCRpred1, ‘tr’,’fr’)
plot(ROCRperf1, colorize = TRUE )
Now, plot glm function using ggplot2 library
library(ggplot2)
ggplot(train, aes(x=Rating, y=Recommend)) + geom_point() +
stat_smooth1(method=”glm”, family=”binomial”, se=FALSE)
CONCLUSION AND INTERPRETATION:
GLM () model does not assume that there is any linear relationship between independent or dependent variables. Nevertheless, it does assume a linear relationship between link function and independent variables in the logistic model. Here, we got a 59% classification rate that really not bad. This means using a smaller model may perform better. None of the predictors is significant, P-value is better which indicates an increase in prediction.
The blog is intended to help people learn and perform Logistic Regression in R. Understanding Logistic Regression has its own difficulties. It is quite similar to Multiple Regression but differs in the way a response variable is predicted or evaluated.
While working on classification problem. I would recommend you to develop your first model as Logistic Regression. The reason being that you might score a remarkable efficiency even better than non-linear methods.
While reading and practicing this tutorial, if there is anything you don’t know, don’t wait to drop in your comments below!